THE ALBERTA
COLLISION RATES SCOREBOARD
This website is designed for viewing on laptop and desktop computers.
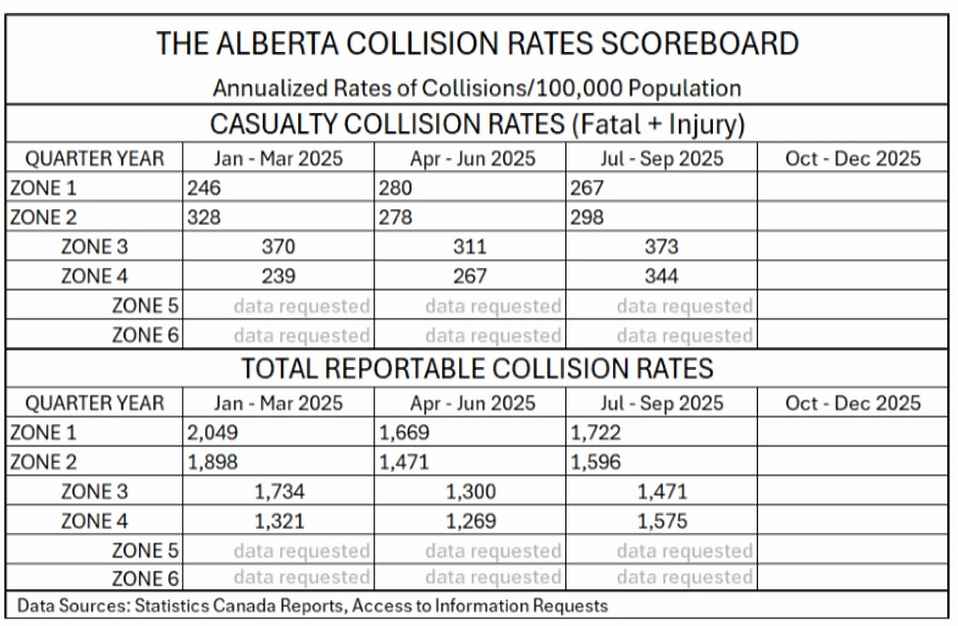
Check the Scoreboard and Fig. 1 – 6 below to see how your Zone is doing
in reducing the main cause of the high cost of collision insurance.
Zone 1 - 4 information was updated Nov. 12, 2025. Zone 5 and 6 data for
Medicine Hat, Lethbridge, Calgary, and Camrose has been requested.
Data for Edmonton, Lacombe and Taber has been received.
Zone locations and boundaries are described on the ZONES page.

The Scoreboard provides collision rates for the six driver zones of Alberta:
-
four (1 - 4) are served by RCMP detachments,
-
two (5, 6) have standalone police services.
Figures 1 - 6 compare the progress of the zone pair members in reducing collisions.


DRIVER ERRORS
Fig. 7 shows the pattern of driver actions that led to fatal and injury collisions.
A Complication
Alberta Transportation discontinued reporting minor and minimal injury statistics that occurred after 2021; consequently, the pattern to the left of the starred vertical line is for actions up to 2022 that led to casualty collisions (fatal collisions plus major, minor and minimal injury collisions) whereas the pattern to the right of the starred vertical line is for actions after 2021 that led to fatal and major injury collisions.

Review of the data from 2012 to 2023 shows that the three most common driver errors that led to a casualty collision on a non-intersection roadway were
Ran Off Road
Left of Centre
Followed Too Closely.
The three most common driver errors that led to a casualty collision at an intersection were
Disobey Traffic Sign or Signal
Left Turn Across Path
Followed Too Closely.
The above driver errors also led to reportable property damage only collisions.
Fig. 7 will be updated annually following release of Alberta Transportation’s Alberta Traffic Collision Statistics report.
COLLISIONS WITH ANIMALS
In contrast to the other western provinces, Alberta Transportation evidently does not include collisions with animals in its annual collision report and in its data submitted to Transport Canada. Alberta collisions with animals amount to about 2% of fatal collisions, about 4% of non-fatal injury collisions, and about 10% of reportable property damage only collisions each year.
The Alberta Wildlife Watch Program Alberta Wildlife Watch (https://albertawildlifewatch.ca/) provides statistics and maps about roadway collisions involving large bodied animals.

CANADA AND ALBERTA COLLISION FATALITY RATES
As shown in Fig. 8, the Alberta collision fatality rate exceeds the average for Canada. (The 2019 dip is due to the pandemic.)

Fig. 8 will be updated annually as data becomes available from the Transport Canada publication Canadian Motor Vehicle Traffic Collision Statistics.
Fig. 9 below shows a path to an initial target – that of reducing the Alberta collision fatality rate to less than the average for Canada. The 2035 target corresponds to an annual provincial average of less than 175 casualty collisions per 100,000 residents.

Achieving the improvement as shown means that Albertans will have avoided an average of 8 fatalities, 70 major injuries, 400 minor injuries and 3,300 reportable collisions each year of the indicated transition period.
Additional benefits of decreasing collisions by one-third include lower collision insurance cost, smoother traffic flow, reduced demands on expensive public services, and increased ability to withstand the effect of tariffs on trade to the U.S.